If you are monitoring lots of hosts, getting an overview of which hosts need attention can be difficult. Most likely you've split the hosts among several pages, and the "All non-green" view is just cramped full with systems where a logfile is showing some errors, a filesystem needs cleaning up etc.
The "Critical Systems" view lets you define exactly which
tests on what hosts need attention. In other words, this is the view
your Operations Center will be using to decide whether to call out
people in the middle of the night. It might look like this:
This document describes how you configure the Critical Systems view, and how it works for your operators. By "operators" I mean the people who are doing the 24x7 monitoring. Where I work, these people normally do not resolve the issues - they just raise the trouble-tickets and assign them to the "engineer" on duty. It may be different in your organization.
To configure what goes on the Critical Systems view, you use a dedicated editor.
The default Xymon setup has nothing on the critical systems view. So to use it, you must configure some of your systems and tests to be included on this view. From the Administration menu, pick the Edit Critical Systems item. This is usually in the password-protected area of Xymon, so you will need to authenticate yourself before you are allowed access. If you haven't set this up yet, look at the installation guide to see how you do that.
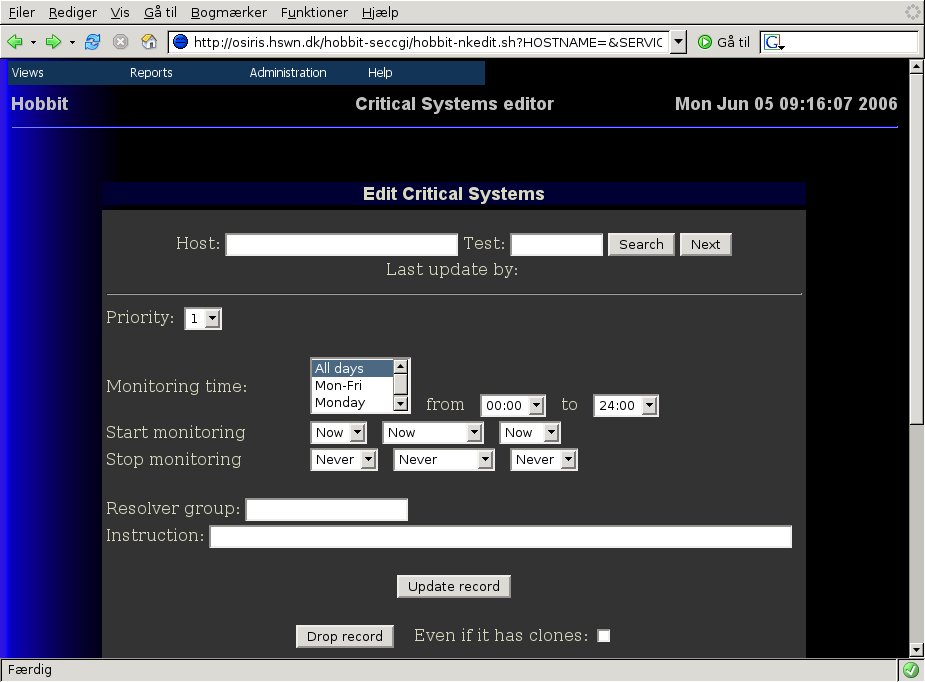
After authenticating, you are presented with the editor page.
Right now, there is a yellow disk status on my system.
But it is not on the Critical Systems view, and I want it to be. It is a priority 3 event, and I only want it monitored between 7AM and 8PM on weekdays. Most likely it is just some logfiles that are filling up, so the operators can try and clean out the /var/log/ directory - if that doesn't solve the problem, then they must escalate it to the Unix admins.
So on the Critical Systems editor, I enter the hostname localhost
and the test disk, then hit the Search button. I get this
warning:
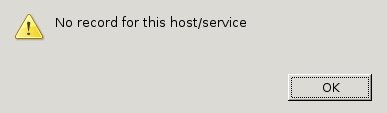
So I fill out the fields of the form and hit the Update button.
The form changes to look like this: 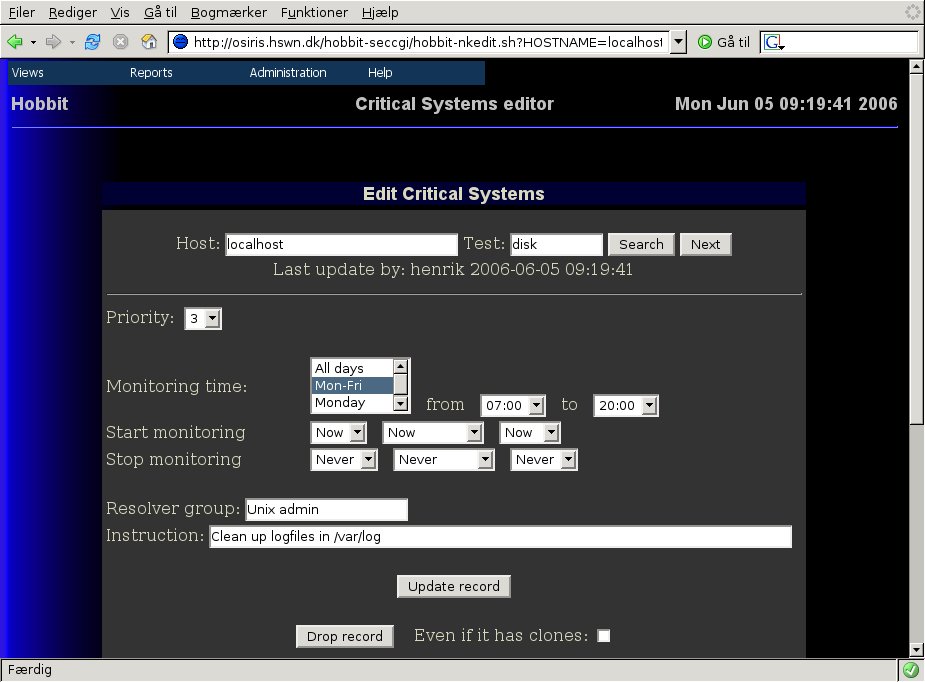 As you can see, there is now a Last update text showing who has
changed this configuration, and when it was last done.
As you can see, there is now a Last update text showing who has
changed this configuration, and when it was last done.
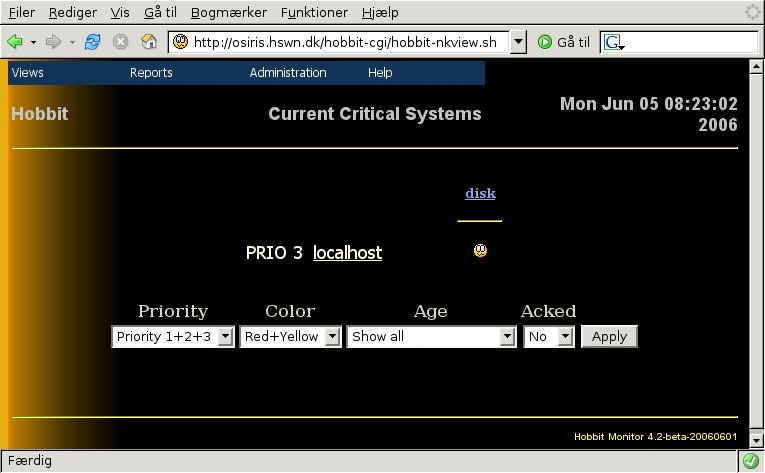
If I now go back to the Critical Systems view - from the menu, pick
Views and Critical Systems view - you will see that the
status is now showing up:
If you have many hosts that share a common setup on the Critical Systems view, then editing all of them can be tiresome. Instead, you should define a template and then clone it to all of the hosts.
NOTE: A cloned definition is not a copy of the original definition. It is in fact a pointer back to the original definition, so if you change the original definition after you performed the cloning, then the clone definition will also change.
Defining a template is just like defining the Critical Systems
view for a host. Just call the host something that looks like a
template - "Standard Unix", for instance. So here
is a definition for a Unix cpu template.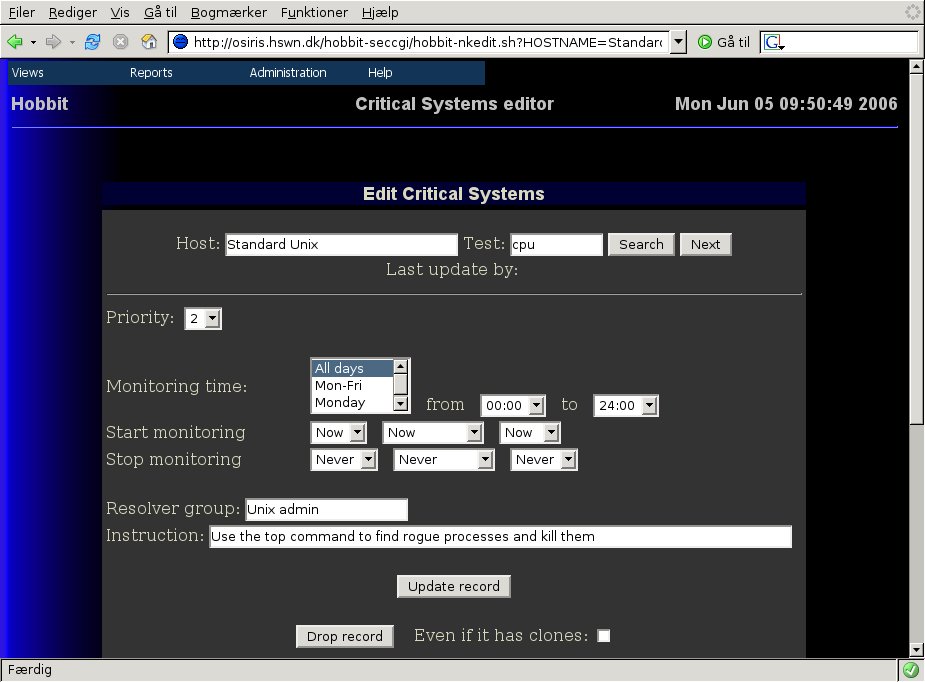
Now we have created the template (if you haven't pushed the Update
button to save the template, do it now). To apply this template to a host,
scroll down to the bottom of the editor form, and enter the hostname that
you want to apply the template to, then hit the Add/remove clones
button: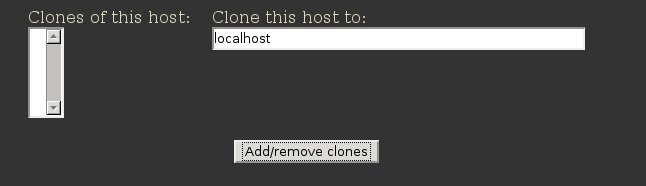
After it has updated, you can see that "localhost" is now listed
in the scrollbox showing the clones.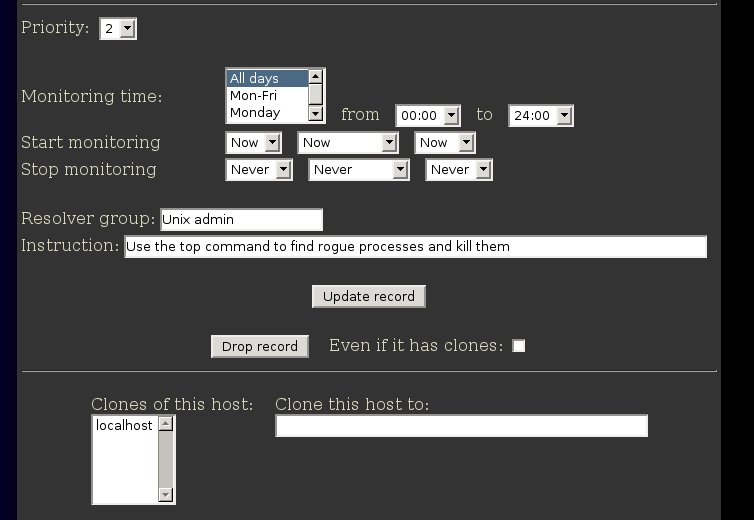
NOTE: Cloning happens at the host level, so even though we did the cloning from a cpu test definition, it will also affect all the other definitions we have for the Standard Unix host.
The critical systems view lets the operators filter active
alerts in several ways. It might look like this:
The drop-down boxes lets the operators filter the alerts that show up on the page.
Tip: If you have a preferred default setting for these, then you can bookmark it in your browser - the settings are part of the URL, so your bookmark will include the current settings.
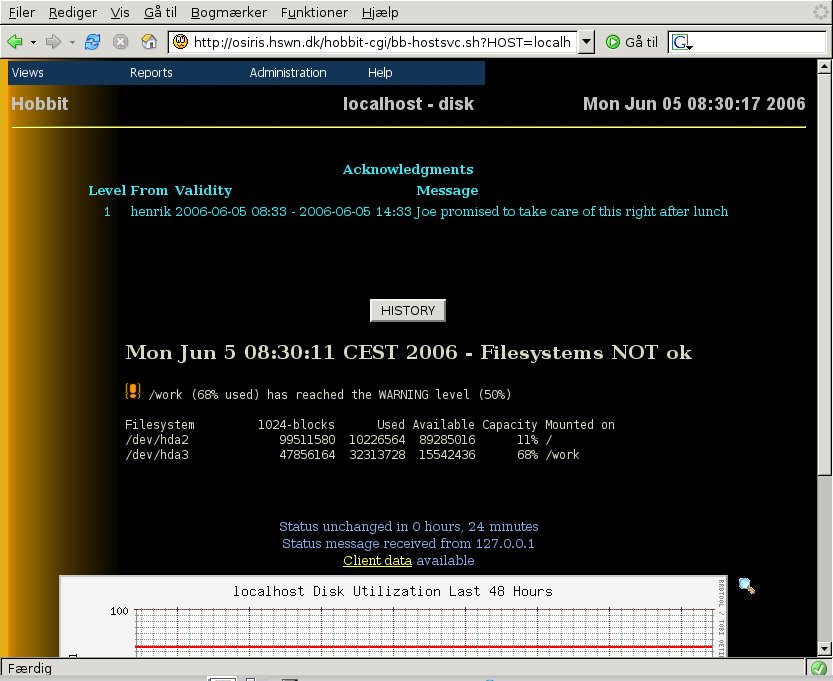
When looking at the status of one of the items shown on the Critical Systems view, a number of additional items show up. On the example Critical Systems view above, you will notice that the instructions we entered about what to do with the disk status is shown here, so they are available to the operators. There are links to the host documentation and host information. There is also an acknowledge function, so that the operators can acknowledge an alert right away.
From the detailed status view, the operator can acknowledge an alert, after he has assigned the problem to an engineer or has handled it in some other way. This serves two purposes: First, it removes the status from the Critical Systems view, so the operator can concentrate on the new problems that appear. And second, it lets everyone else see that the problem has been noticed and is being handled by someone.
When acknowledging an alert, the operator can add information
about what the problem is, or who is handling it, and when it
is expected to be resolved. E.g. like this:
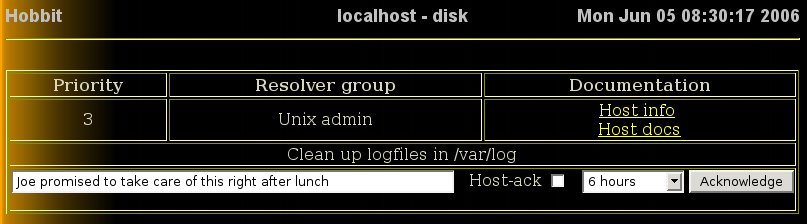
The Host-ack checkbox lets the operator acknowledge all current alerts for a given host, e.g. a full disk could easily trigger alerts for both the disk-, msgs- and procs-statuses - a Host ack lets him handle all of those.
After the operator has acknowledged the status, the acknowledgment
will be visible on the Critical systems status view:
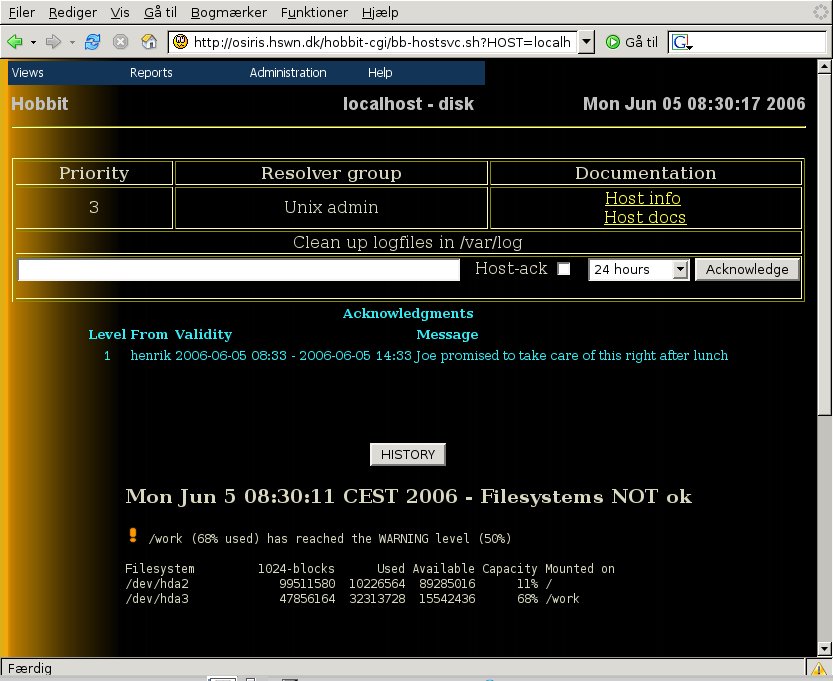
(If you are wondering why this image says it is a "Level 1" acknowledgement, then the answer is that a future release of Xymon will allow multiple acknowledgments by different groups. Level 1 is the operator who sees the alert on the Critical Systems view. Level 2 could be the engineer who gets paged by a Xymon alert going out).
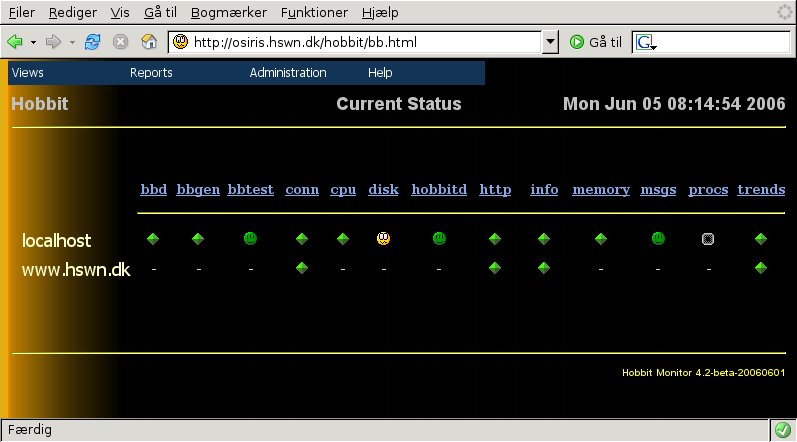
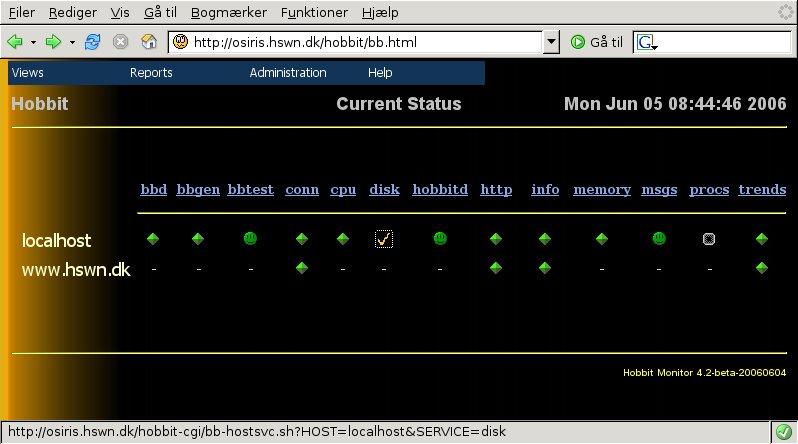
The acknowledgments that the operator enters from the status
page will show up on the status visible to everyone. E.g. here is
how the overview page will appear to a normal user: Note that the
"disk" status has a yellow checkmark, indicating that it
has been acknowledged:
And the detailed status page also includes the acknowledgment
information: